
Public transport use up, say new NTS figures
Trip rates increase for both bus and rail in survey update
 The Department for Transport (DfT) has published new data from its National Travel Survey†, combining data from the last six months of the 2023 survey with the first six of 2024. The limited number of tables predates publication of the full 2024 survey results later in the year. NTS has been an England-only project since 2012.
The figures point to a continuing recovery from the Covid-19 pandemic, with overall trip rates increasing over the year since the last set of interim results. The public made an estimated 922.4 trips per person per year (tpppy) by all modes in 2023/24, up by 4.6 per cent compared with 2022/23. However, the figure remained 3.2 per cent below the 2019 figure of 952.6 trips. Shopping trips, for long the backbone of travel demand, increased slightly, up 1.4 per cent to 167.8 tpppy, but still down by 7.1 per cent from 2019’s figure of 180.6.
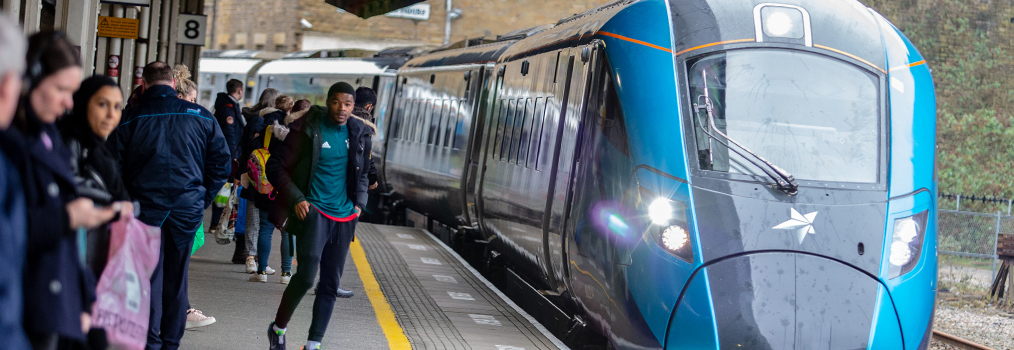
In rail, the trip rate increased by 9.2 per cent, reaching 18.9 tpppy compared with 17.3 in 2022/23. The last pre-Covid figure recorded in 2019 was 22.1, leaving a shortfall of 14.5 per cent.
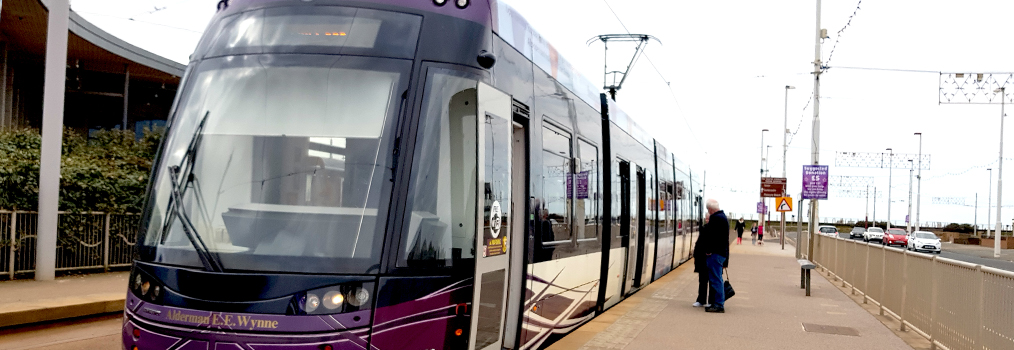
Looking specifically at the bus market in England outside London, the overall trip rate was up by 15.1% to reach 27.0. The last pre-Covid figure recorded in 2019 was 31.6, leaving a shortfall of 14.6%.
This latest update to the National Travel Survey offers further confirmation, if it were needed, that patronage on the national rail system is continuing to recover from the shock of the Covid-19 pandemic, but that the changes in consumer behaviour have been radical, and the new pattern seems to be settling in for the long term.
This both echoes and reinforces figures from the DfT which suggest that rail demand was advancing, albeit very slowly. Patronage averaged 88.7 per cent of pre-pandemic levels excluding the Elizabeth Line between January and April this year. This compared with 85.8 per cent across the whole of 2024 and 87 per cent in fiscal year 2024/25.
Bus, on the other hand, might be going backwards. The same DfT figures show that in the first four months of this year, demand averaged just over 86% of pre-pandemic levels outside the capital and just below 86% in London. This compared with 89.3% and 88.8% respectively during calendar year 2024 and 87.9% in both during fiscal year 2024/25.
The NTS update goes a long way to explaining the shortfalls, mapping both the changes in journey purpose and in the age and gender of rail users. The loss of commuting trips is well known and understandable, given the moves towards working from home and hybrid working. Some 275 million commuting trips a year have been lost since 2019 – rather more than the national shortfall of 215 million. Business travel accounts for a further 67.4 million lost journeys. However, these losses are offset to some extent by gains in education (33 million) and leisure travel (a whopping 132.2 million. As noted, It is salutary that leisure travel now accounts for a greater market share of trips than commuting.
The shifts in the age profile of users both reflects and influences this. The fall in commuter trips can be linked with the decline in trip rates amongst those between 30 and 59, whilst the increased usage amongst the under 17s can be linked to the rise in educational and leisure travel. The recovery in trip rates amongst older people is also presumably about leisure trips, and is in sharp contrast to the bus industry.
On the buses, the loss of shopping trips is particularly significant, accounting for some 367 million trips a year compared with 2010. This represents 57% of the 595 million passenger journeys lost since then. Other journey purposes have also seen declines, including personal business (78.7 million, or 13.2% of the loss), leisure trips (69.5 million trips, or 11.7% of the loss) or commuting patterns (36.9 million trips, 6.2% of the loss).
The survey confirms that trip rates amongst older people remain well down, by 38.4% amongst the 60-69 age band and 15.1% amongst the over 70s. Looking back to 2010, shortly after the introduction of the English National Concessionary Scheme, trip rates for the 60-69 age groups have plummeted by almost 54%, and for the over 70s by 39%. Any boost that free fares gave to demand has long since disappeared, and should act as a warning to those who believe that cutting the fares is the only thing needed to bring passengers back to the bus; judging by these figures, people don’t use bus travel much even when you give it away.
Quite where this leaves the bus and rail industries as they stand on the brink of another major reorganisation is an open question. Both are in a much better place than a year ago, but there are huge issues ahead: the nature and extent of government funding, especially in the context of the crisis in public finances; wider economic uncertainty and social change resulting from the continuing hi-tech revolution; and the impact of new technology and net zero targets on the industries themselves. All will continue to have profound effects on the markets for bus and rail services.
Links for more detailed analysis:
Bus trip making up, says new NTS Update
National Travel Survey update shows rises in rail use
The National Travel Survey mid-year estimates are available at https://www.gov.uk/government/statistics/national-travel-survey-mid-year-estimates-year-ending-june-2024
† - The NTS is a household survey of personal travel, from data collected via interviews and a seven-day travel diary, which enables analysis of patterns and trends. The statistics for the year ending June 2024 include data from the second half of 2023 and the first half of 2024. The results are based on a sample size of 7,518 households.