
Latest NTS results show further rise in rail trip making
9.2 per cent growth as leisure travel overtakes commuting as main reason for rail use
The Department for Transport (DfT) has published new data from its National Travel Survey*, combining data from the last six months of the 2023 survey with the first six of 2024. The limited number of tables predates publication of the full 2024 survey results later in the year.
The figures point to a continuing recovery from the Covid-19 pandemic, with overall trip rates increasing over the year since the last set of interim results. The public made an estimated 922.4 trips per person per year (tpppy) by all modes in 2023/24, up by 4.6 per cent compared with 2022/23. However, the figure remained 3.2 per cent below the 2019 figure of 952.6 trips. Shopping trips, for long the backbone of travel demand, increased slightly, up 1.4 per cent to 167.8 tpppy, but still down by 7.1 per cent from 2019’s figure of 180.6.
Looking specifically at the rail market in England, the overall trip rate increased by 9.2 per cent, reaching 18.9 tpppy compared with 17.3 in 2022/23. The last pre-Covid figure recorded in 2019 was 22.1, leaving a shortfall of 14.5 per cent.
Analysis of responses on people’s reasons for making their journey shows that trip rates increased over the last twelve months for all purposes except education (down 2.4 per cent). Comparing 2022/23 rates with those of 2019, we see a continuing shortfall in three categories: business travel (39.7 per cent), commuting (34.1 per cent) and personal business (0.3%). There were increases in the other purposes, though, including escort trips (53.1 per cent), education (24.7 per cent), leisure (25.8%) and shopping (4.6%). The chart at Figure 1 illustrates the changes, but also shows the same figures for 2010, and we see that gains made between 2010 and 2019 have been wiped out – especially in commuting and the lucrative business travel market.
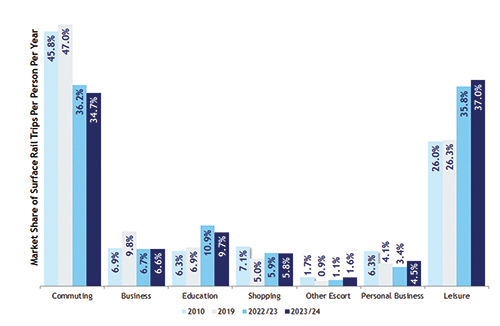
Translating those trip rates into percentage shares, we see from Figure 2 that the importance of commuting has diminished, now accounting for 34.7 per cent of trips, twelve points lower than in 2019. Leisure travel now accounts for 37 per cent of passenger journeys, and has overtaken commuting as the single largest reason for using the railway. Business travel has fallen back from 9.8 per cent to 6.6 per cent, one of the reasons that revenue yields have failed to recover. The change has wiped out a decade of steady growth and taken the market share back below 2010 levels. The increased importance of education is notable, though it fell back slightly in the most recent survey. Shopping too has seen a small increase in trip rate but has a lower share of the market than in 2022/23.
Figure 1: Changes in Surface Rail Trip Rates by Journey Purpose
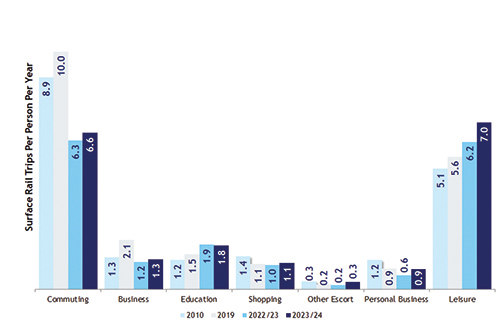
Figure 2: Shifts in the Market Share of Surface Rail Trips by Journey Purpose
There have been major shifts in the demographic profile of rail users, according to the survey, with trip rates recovering amongst older people (see table). The growth in 2023/24 covered all ages except the 17-20 year olds, where there was a 14.2 per cent drop in trip rates – particularly amongst young men, where the fall was over 23 per cent. Amongst the 21-29 year olds, there was a barely perceptible improvement of 0.4 per cent. Strongest growth of over 45 per cent came amongst the over 70s.
Comparing trip rates with the last pre-pandemic year, two age-groups, the under 17s and between 21 and 29, actually show an improvement of 38.7 per cent and 11.3 per cent respectively, but the others show sharp falls: this is as high as 23.9 per cent amongst those aged 40-49 and 23.5 per cent for those in their fifties. Those age groups coming closest to recovery were 60-69 and 70+, the latter coming to within 3.7 per cent of pre-Covid trip rates; this is in stark contrast to the bus market, where trip making amongst older people remains significantly down, despite free off-peak travel.
There are significant differences in behaviour between men and women. Overall, women’s trip rates came within 94 per cent of the 2019 figure, whilst men only reached 88.3 per cent. In the most recent twelve-month period, trip rates amongst all males under 30 fell, whereas females under 17 and in their twenties reported higher rates. Overall, men made more rail trips than women in all three surveys shown, though the gap has narrowed since 2019.
Surface Rail Trip Rates by Age and Gender (trips per person per year)
| <17 | 17-20 | 21-29 | 30-39 | 40-49 | 50-59 | 60-69 | 70+ | All Ages | |
| All People | |||||||||
| 2019 | 6.5 | 36.4 | 31.5 | 36.0 | 30.3 | 24.4 | 15.5 | 7.2 | 21.2 |
| 2022/23 | 8.9 | 34.2 | 34.9 | 23.6 | 21.5 | 16.0 | 11.9 | 4.8 | 17.3 |
| 2023/24 | 9.0 | 29.3 | 35.1 | 28.9 | 23.1 | 18.6 | 14.0 | 6.9 | 18.9 |
| % change since 2019 | 38.7 | (19.5) | 11.3 | (19.7) | (23.9) | (23.5) | (9.5) | (3.7) | (11.0) |
| Last Year % change | 1.2 | (14.2) | 0.4 | 22.6 | 7.4 | 16.6 | 17.4 | 45.2 | 9.2 |
| Males | |||||||||
| 2019 | 6.1 | 45.3 | 31.7 | 43.6 | 42.2 | 28.5 | 15.7 | 7.8 | 24.9 |
| 2022/23 | 9.3 | 26.8 | 34.2 | 26.4 | 24.6 | 18.2 | 12.5 | 4.6 | 18.2 |
| 2023/24 | 9.1 | 20.6 | 32.3 | 34.3 | 27.0 | 22.8 | 16.1 | 6.9 | 20.3 |
| % change since 2019 | 50.2 | (54.5) | 1.7 | (21.3) | (36.1) | (20.0) | 2.4 | (11.8) | (18.5) |
| Last Year % change | (2.2) | (23.1) | (5.6) | 29.7 | 9.8 | 25.6 | 29.2 | 49.8 | 11.7 |
| Females | |||||||||
| 2019 | 6.9 | 27.1 | 31.3 | 28.5 | 18.7 | 20.3 | 15.2 | 6.6 | 17.7 |
| 2022/23 | 8.4 | 41.8 | 35.7 | 20.9 | 18.5 | 13.9 | 11.4 | 4.9 | 16.5 |
| 2023/24 | 8.8 | 38.4 | 37.9 | 23.9 | 19.3 | 14.6 | 12.0 | 6.9 | 17.5 |
| % change since 2019 | 28.1 | 41.8 | 21.1 | (16.4) | 3.6 | (28.1) | (21.3) | 4.3 | (0.6) |
| Last Year % change | 5.2 | (8.1) | 6.2 | 14.1 | 4.5 | 5.4 | 5.1 | 41.5 | 6.5 |
* - The NTS is a household survey of personal travel, from data collected via interviews and a seven-day travel diary, which enables analysis of patterns and trends. The statistics for the year ending June 2024 include data from the second half of 2023 and the first half of 2024. The results are based on a sample size of 7,518 households. The National Travel Survey mid-year estimates are available at https://www.gov.uk/government/statistics/national-travel-survey-mid-year-estimates-year-ending-june-2024.