

Recovery is patchy as under 30s make fewer trips and over 60s’ trip rates remain depressed
The Department for Transport (DfT) has published new data from its National Travel Survey, combining data from the last six months of the 2023 survey with the first six of 2024. The limited number of tables predates publication of the full 2024 data later in the year.
The figures point to a continuing recovery from the Covid-19 pandemic, with overall trip rates increasing over the year since the last set of interim results. The public made an estimated 922.4 trips per person per year (tpppy) by all modes in 2023/24, up by 4.6 per cent compared with 2022/23. However, the figure remained 3.2 per cent below the 2019 figure of 952.6 trips. Shopping trips, for long the backbone of travel demand, increased slightly, up 1.4 per cent to 167.8 tpppy, but still down by 7.1 per cent from 2019’s figure of 180.6.
Looking specifically at the bus market in England outside London, the overall trip rate was up by 15.1% to reach 27.0. The last pre-Covid figure recorded in 2019 was 31.6, leaving a shortfall of 14.6%.
Analysis of responses on people’s reasons for making their journey, trip rates for all purposes increased (see Figure 1). Strongest growth came for business travel, personal business and leisure travel. There were smaller increases in commuting and shopping trips.
When comparing the 2022/23 trip rates with those of 2019, we see a shortfall in all but one category. Largest shortfalls were in education (22.3%), personal business (16.1%) and shopping (15.7%). Commuting was 14.2% below 2019.
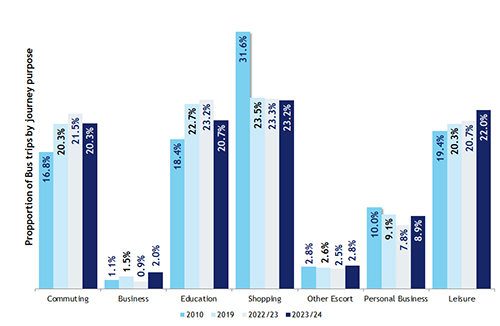
Translating those trip rates into estimated passenger numbers, we see from Figure 2 that there is now a roughly even split in percentage terms between commuting/business (22.3%), shopping (23.2%), education 20.7%) and leisure (22.0%). In the days before online retail took off, shopping tended to predominate, accounting for over 30% of trips in the first decade of the century.
Figure 1: Changes in Trip Rates by Journey Purpose
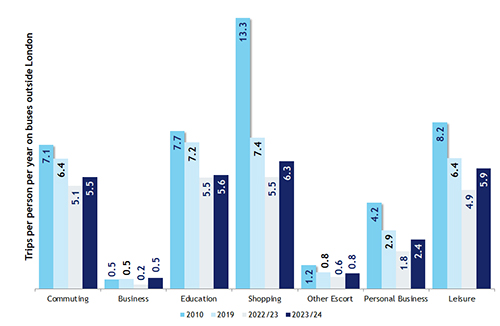
Figure 2: Shifts in the Market Share of Bus Trips by Journey Purpose
There have been some major shifts in the demographic profile of bus users, according to the survey, with trip rates falling across the generations, but particularly amongst older people (see table). The overall recovery in 2023/24 did not cover all age groups: there were continuing falls in trip rates amongst those in 17-20 and 21-29 age bands. The highest year-on-year growth came in the 60-69 age band, showing an increase of 38.4%, followed by the 50-59 band on 36.6%.
Comparing trip rates with the last pre-pandemic year, two age-groups actually show an improvement: the 30-39 group are 22.7% up on 2019, and the 40-49 group are 8.1% higher. The others show sharp falls: two age bands show shortfalls of over 20% - the under 17s and the over 70s.
There are some significant differences in behaviour between men and women, with the latter showing a much stronger recovery in 2023/24 in some age bands, but falls in three – 17-20, 40-49 and 50-59. Females continue to make more bus trips than men, with the gap widening with age.
Bus Trip Rates by Age and Gender (trips per person per year)
| <17 | 17-20 | 21-29 | 30-39 | 40-49 | 50-59 | 60-69 | 70+ | All ages | |
| All People | |||||||||
| 2019 | 36.5 | 73.3 | 33.0 | 19.9 | 18.5 | 20.9 | 30.7 | 46.4 | 31.6 |
| 2022/23 | 24.9 | 64.9 | 27.7 | 20.6 | 15.9 | 12.9 | 17.9 | 30.4 | 23.5 |
| 2023/24 | 28.3 | 59.9 | 25.1 | 24.4 | 20.0 | 17.7 | 24.7 | 36.9 | 27.0 |
| % change since 2019 | (22.4%) | (18.3%) | (23.7%) | 22.7% | 8.1% | (15.6%) | (19.5%) | (20.7%) | (14.6%) |
| Last Year % change | 13.8% | (7.7%) | (9.2%) | 18.6% | 25.7% | 36.6% | 38.4% | 21.0% | 15.1% |
| Females | |||||||||
| 2019 | 37.0 | 78.0 | 32.0 | 26.6 | 27.0 | 24.9 | 39.3 | 52.4 | 36.1 |
| 2022/23 | 26.1 | 64.7 | 33.6 | 25.9 | 14.4 | 14.8 | 20.8 | 33.2 | 25.9 |
| 2023/24 | 30.7 | 59.6 | 25.0 | 30.3 | 22.7 | 24.5 | 31.0 | 43.1 | 31.2 |
| % change since 2019 | (17.0%) | (23.6%) | (21.7%) | 13.9% | (15.9%) | (1.4%) | (21.0%) | (17.7%) | (13.7%) |
| Last Year % change | 17.6% | (7.8%) | (25.7%) | 16.9% | 57.7% | 65.4% | 49.5% | 29.9% | 20.5% |
| Males | |||||||||
| 2019 | 36.1 | 68.9 | 34.0 | 13.1 | 9.8 | 16.9 | 21.8 | 39.3 | 27.0 |
| 2022/23 | 23.8 | 65.1 | 21.5 | 14.9 | 17.5 | 10.9 | 14.8 | 27.2 | 21.0 |
| 2023/24 | 26.1 | 60.3 | 25.3 | 18.1 | 17.1 | 10.5 | 18.1 | 29.3 | 22.7 |
| % change since 2019 | (27.6%) | (12.5%) | (25.6%) | 38.8% | 75.4% | (37.7%) | (16.7%) | (25.4%) | (16.0%) |
| Last Year % change | 9.8% | (7.5%) | 17.5% | 21.7% | (1.9%) | (4.1%) | 22.1% | 7.9% | 8.1% |