
Commuting and leisure trip rates decline as men make many fewer trips
The new data published recently by the Department for Transport (DfT) from its National Travel Survey*, enables us to gain an insight into the recent major changes in which Londoners use the bus, and the reasons for their trips. The update combined data from the last six months of the 2023 survey with the first six of 2024. The limited number of tables predates publication of the full 2024 data later in the year.
The London public as a whole made an estimated 739 trips per person per year (tpppy) by all modes in 2023/24, down by 3.2% compared with 2023/24. The fall meant that Londoners made 10.5% fewer trips than the 816.5 figure recorded in the 2019 survey.
Looking specifically at the bus market in the capital, the figures point to a surprising reversal in trip making. Overall trip rates for Bus in London fell by 21.4% to 12.6 from the 16.0 recorded in last year’s mid-year update. This leaves bus trip rates more than 30% lower than before the pandemic.
Analysis of responses on people’s reasons for making their journey, trip rates for all purposes except business fell sharply between 2022/23 and 2023/24 (see Figure 1). The largest decline was in education trips (down 41.5%), commuting (30.8%) and shopping – for so long the backbone of travel demand – down by 11.0%. Looking back to 2019, we see a fall in all categories, ranging from 51.7% for commuting to 27.4% for leisure travel. Shopping fell by just 1.2%.
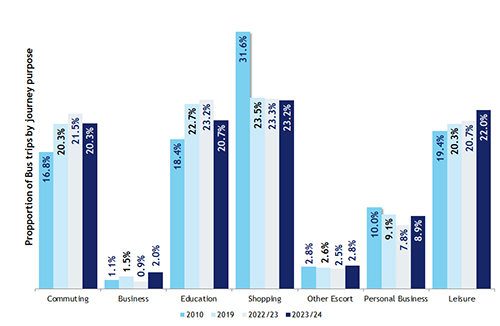
Translating those trip rates into estimated passenger numbers, we see from Figure 2 that there is a roughly even split in percentage terms between commuting/business (19.3%), shopping (23.0%), education (20.0%) and leisure (21.8%). In the days before online retail took off, shopping tended to predominate, accounting for over 25% of trips in the first decade of the century, whilst in the run-up to Covid, commuting by bus became more important, accounting for up to 28% of trips.
Figure 1: Changes in Trip Rates by Journey Purpose
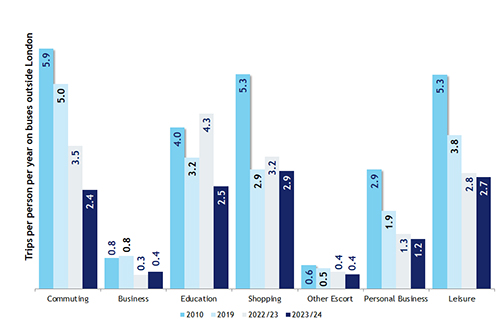
Figure 2: Shifts in the Market Share of Bus Trips by Journey Purpose
There have been further major shifts in the demographic profile of bus users, according to the survey. The fall in trip rates took place across all age groups though there were some exceptions in individual genders, discussed below. The biggest falls came for people in their thirties (44% down) and twenties (32.5%).
Comparing trip rates with the last pre-pandemic year, the falls range between 10.8% for those under 17 to 46.3% amongst those aged between 21 and 29. Other age groups losing more than 40% of their 2019 trips include those in their thirties and fifties.
There are some significant differences in behaviour between men and women, with the former showing larger falls in bus use since 2019. In total, men made 43.6% fewer trips whilst the figure for women was 39.4%. Three male age cohorts show an increased trip rate. These were men aged 17-20 (up 21%), aged 50-59 (up 49.4%) those aged 60-69 (up 4.6%).whilst there was only a small fall for men in their forties. However, those aged 17-20 recorded 74.5% fewer trips, with those aged 21-29 showing a fall of 60.6%. Women in two age-groups, those aged under 17s and 17-29, also took more trips than in 2019. Highest loss was amongst women aged 50-59 down 56.5%. Despite all these shifts, women continued to make more bus trips than men, across all ages except the under 17s.
As with the rest of the country, there was a significant loss of trips amongst older people since the pandemic, with a mixed picture across the genders. The men showed trip rates down 22.1% for the over 60s and 41.2% for the over 70s, compared with women, down 37.1% and 7.2% respectively.
Bus Trip Rates in London by Age and Gender (trips per person per year)
| All ages | <17 | 17-20 | 21-29 | 30-39 | 40-49 | 50-59 | 60-69 | 70+ | |
| All People | |||||||||
| 2019 | 6.5 | 36.4 | 31.5 | 36.0 | 30.3 | 24.4 | 15.5 | 7.2 | 21.2 |
| 2022/23 | 15.8 | 28.2 | 22.6 | 19.4 | 12.6 | 11.2 | 14.7 | 12.8 | 16.0 |
| 2023/24 | 13.6 | 22.6 | 15.3 | 10.9 | 12.0 | 9.7 | 12.0 | 11.5 | 12.6 |
| Change since 2019 | 110.7% | (37.9%) | (51.5%) | (69.8%) | (60.5%) | (60.2%) | (22.6%) | 60.8% | (40.7%) |
| Last Year % change | (13.8%) | (19.7%) | (32.5%) | (44.0%) | (4.9%) | (13.4%) | (18.4%) | (9.8%) | (21.4%) |
| Males | |||||||||
| 2019 | 15.3 | 25.8 | 28.4 | 19.8 | 14.0 | 17.6 | 17.4 | 15.0 | 18.2 |
| 2022/23 | 20.0 | 17.6 | 14.7 | 11.7 | 12.2 | 5.6 | 10.4 | 11.8 | 13.1 |
| 2023/24 | 14.1 | 21.3 | 7.2 | 7.8 | 8.2 | 8.4 | 10.9 | 9.1 | 10.3 |
| Change since 2019 | (7.9%) | (17.4%) | (74.5%) | (60.6%) | (41.8%) | (52.3%) | (37.3%) | (39.2%) | (43.6%) |
| Last Year % change | (29.7%) | 21.0% | (50.8%) | (33.3%) | (33.3%) | 49.4% | 4.6% | (22.6%) | (21.8%) |
| Females | |||||||||
| 2019 | 25.6 | 21.3 | 41.3 | 39.2 | 32.7 | 25.6 | 15.3 | 17.7 | 22.5 |
| 2022/23 | 20.0 | 12.7 | 23.1 | 33.3 | 22.6 | 15.7 | 25.2 | 20.6 | 14.6 |
| 2023/24 | 18.8 | 11.4 | 39.0 | 30.2 | 26.6 | 13.0 | 16.6 | 18.7 | 13.6 |
| Change since 2019 | (26.6%) | (46.7%) | (5.4%) | (23.0%) | (18.6%) | (49.3%) | 8.6% | 5.5% | (39.4%) |
| Last Year % change | (6.1%) | (10.6%) | 69.0% | (9.1%) | 17.8% | (17.5%) | (34.2%) | (9.3%) | (6.5%) |